


Gold has never been “just a metal” in India. It is tradition, status, emotional security, and in many households, a long-term financial plan. From weddings and festivals to emergency liquidity and generational wealth, gold sits at the intersection of culture and economics. That’s why tracking gold prices in India over the last 50 years is not simply a commodity exercise—it’s a window into India’s inflation cycles, currency movements, global crises, and changing investor psychology.
In this detailed, SEO-focused guide, you’ll get:
- A year-by-year gold price table (₹ per 10 grams, 24K)
- A decade-wise analysis of key periods of rise, fall, and consolidation
- The biggest annual jumps and corrections and what caused them
- A deep explanation of why gold surged sharply in 2026 and what it means next
This piece takes historical trend inputs from widely referenced gold price history tables and India-focused gold trend resources, including BankBazaar’s gold rate trend coverage.
Year-by-Year Gold Price in India (24K, ₹ per 10 grams)
Before we interpret the story, we need the numbers. Here is a year-wise historical price table, which forms the backbone of the analysis.
Note: Historical gold price datasets can vary slightly across compilations due to methodology (average vs year-end, city benchmarks, tax/making charges exclusion). The table below uses a commonly referenced annual series used across Indian gold history summaries and trend resources (including BankBazaar-style historical trend listings).
Annual Gold Price Table (₹/10g)
| Year | Price | Year | Price | Year | Price |
|---|---|---|---|---|---|
| 1964 | 63 | 1985 | 2,130 | 2006 | 8,400 |
| 1965 | 72 | 1986 | 2,140 | 2007 | 9,428 |
| 1966 | 84 | 1987 | 2,570 | 2008 | 12,361 |
| 1967 | 103 | 1988 | 3,130 | 2009 | 15,417 |
| 1968 | 162 | 1989 | 3,140 | 2010 | 18,448 |
| 1969 | 176 | 1990 | 3,200 | 2011 | 24,130 |
| 1970 | 184 | 1991 | 3,466 | 2012 | 29,926 |
| 1971 | 193 | 1992 | 4,334 | 2013 | 28,848 |
| 1972 | 202 | 1993 | 4,140 | 2014 | 27,708 |
| 1973 | 279 | 1994 | 4,598 | 2015 | 26,671 |
| 1974 | 506 | 1995 | 4,680 | 2016 | 30,128 |
| 1975 | 540 | 1996 | 5,160 | 2017 | 29,174 |
| 1976 | 432 | 1997 | 4,725 | 2018 | 30,692 |
| 1977 | 486 | 1998 | 4,045 | 2019 | 35,154 |
| 1978 | 685 | 1999 | 4,234 | 2020 | 47,562 |
| 1979 | 937 | 2000 | 4,400 | 2021 | 47,437 |
| 1980 | 1,330 | 2001 | 4,300 | 2022 | 51,249 |
| 1981 | 1,670 | 2002 | 4,990 | 2023 | 58,836 |
| 1982 | 1,645 | 2003 | 5,600 | 2024 | 75,373 |
| 1983 | 1,800 | 2004 | 5,850 | 2025 | ~1,10,000* |
| 1984 | 1,970 | 2005 | 7,000 | 2026 | ~1,45,000–1,55,000** |
*2025 is approximate annual average based on high-trend retail levels and broad market averages cited in trend coverage.
**2026 reflects early-year highs/trend range; the full-year average can only be known after year-end.
Also read – Silver Prices in India in the Last 50 Years
Also read – Most Profitable Businesses of 2026 in India
The Big Picture: What 50+ Years of Gold Prices Really Show
When you zoom out, India’s gold story is defined by one consistent truth:
Gold rises over the long term, but it doesn’t rise smoothly.
There are years of explosive jumps, years of consolidation, and years of mild correction. But historically, gold has repeatedly regained momentum after periods of weakness.
To understand why, we have to track the major phases.
1) The 1960s–Early 1970s: Gold Was Cheap, But the World Was Changing
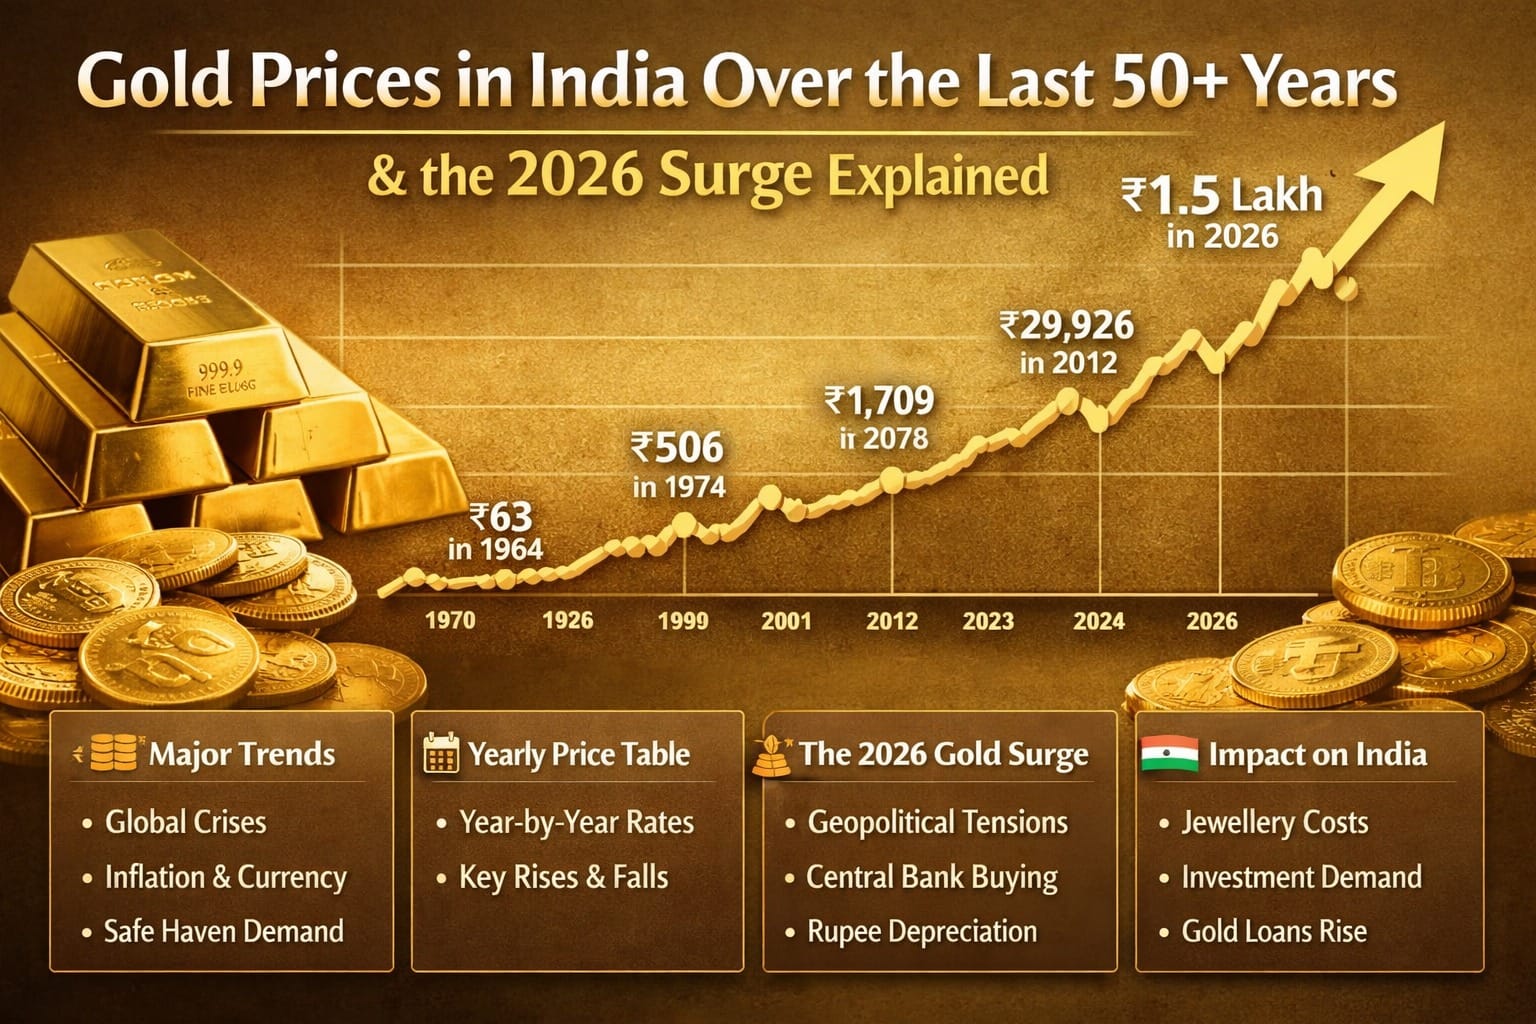
In 1964, gold was just ₹63 per 10 grams—a number that feels unreal today. The late 1960s saw a steady rise as the global monetary system evolved and inflation concerns started to creep into commodity markets.
By 1970, gold hit ₹184, nearly tripling from 1964. That move was driven more by macro factors than Indian demand alone—global currency dynamics and commodity price shifts were setting up what would become the first major boom cycle.
2) The 1970s: The First Real Explosion (And a Visible Dip)
The 1970s delivered India’s first modern gold shock:
- 1973: ₹279
- 1974: ₹506
- 1975: ₹540
The jump from ₹279 to ₹506 is one of the biggest early accelerations in this dataset. Gold often spikes when inflation fear rises, and the 1970s were marked by major inflation pressure globally, plus oil shocks.
But the 1970s also showed something investors still forget today: gold can correct even inside a big bull run.
- 1976 fell to ₹432 after ₹540 in 1975.
Then it climbed again:
- 1978: ₹685
- 1979: ₹937
- 1980: ₹1,330
By the end of the decade, gold’s price behavior had built its “safe-haven” reputation.
3) The 1980s: Uptrend With Consolidation
The 1980s weren’t as dramatic as the 1970s, but they were structurally important. Gold rose from ₹1,330 (1980) to ₹3,130 (1988).
The 1980s also showed stabilization:
- 1982 dipped slightly (₹1,645 vs ₹1,670 in 1981)
- 1986 stayed almost flat (₹2,140 vs ₹2,130 in 1985)
This matters because it highlights gold’s nature: it doesn’t need to spike every year to compound massively over decades.
4) The 1990s: Liberalisation Era, Growth, and a Late- दशक Correction
In India, the 1990s were a decade of massive economic changes. Gold prices moved gradually upward:
- 1990: ₹3,200
- 1992: ₹4,334
- 1996: ₹5,160
But then came an important correction phase:
- 1997: ₹4,725
- 1998: ₹4,045
That dip is a reminder: gold is safe over the long term, but it is not immune to cyclical pressure. Still, by 2000 it recovered to ₹4,400, and then the modern era began.
5) The 2000s: The Start of the “New Gold” Bull Market
If you ask most investors when gold became a mainstream “investment asset,” many point to the 2000s.
Gold rose from ₹4,300 (2001) to ₹7,000 (2005), then accelerated to:
- 2006: ₹8,400
- 2008: ₹12,361
The 2008 global financial crisis further strengthened gold’s safe-haven appeal. When trust in financial systems drops, gold becomes a psychological anchor.
6) 2009–2012: The Super-Rally That Changed Everything
This is arguably the most famous gold rally period:
- 2009: ₹15,417
- 2010: ₹18,448
- 2011: ₹24,130
- 2012: ₹29,926
In just three years (2010 to 2012), gold moved from ₹18,448 to ₹29,926. That’s the kind of multi-year surge that creates a generation of gold believers.
Drivers:
- Global monetary stimulus
- Low/near-zero real interest rates in many economies
- Crisis aftershocks (Europe debt concerns, weak growth)
7) 2013–2015: The Correction Phase (And Why It Was Healthy)
After a super-rally, markets cool. Gold corrected:
- 2013: ₹28,848
- 2014: ₹27,708
- 2015: ₹26,671
This 3-year decline is significant because many people wrongly believe gold “only goes up.” It doesn’t. But corrections create base zones, and after 2015, gold restarted its longer-term climb.
8) 2016–2019: Slow Growth Before the Storm
Gold turned upward again:
- 2016: ₹30,128
- 2017: ₹29,174 (mild dip)
- 2018: ₹30,692
- 2019: ₹35,154
This phase had fewer headlines, but it set the stage for the next explosion.
9) 2020–2022: The Pandemic Era Shock and Sticky Highs
The pandemic pushed gold into another major jump:
- 2020: ₹47,562
- 2021: ₹47,437 (flat but elevated)
- 2022: ₹51,249
When uncertainty spikes, gold becomes the default hedge. This pattern repeats across decades.
10) 2023–2024: A Fresh Acceleration
Gold rose again:
- 2023: ₹58,836
- 2024: ₹75,373
A jump of this magnitude signals renewed macro stress. This period saw:
- Inflation concerns
- global risk-off sentiment
- currency pressures affecting local pricing
Why Gold Surged in 2025–2026: The Real Drivers Behind the Breakout
By 2025, gold entered a new high zone, and in early 2026 it pushed into ₹1.45–₹1.55 lakh per 10 grams territory in several market references and trend discussions.
Here are the most important factors behind the 2026 gold surge:
1) Safe-Haven Demand Returned (Hard)
Gold rallies hardest when markets fear what they can’t price—war risk, trade uncertainty, recession chances, or unexpected policy shocks. Even when equity markets are not “crashing,” gold can surge if investors feel the environment is unstable.
2) Central Banks Buying Gold (Structural Support)
One of the biggest hidden drivers of modern gold prices is central bank accumulation. When central banks add gold to reserves, it reduces available supply in markets and signals institutional demand.
3) Inflation and Real Rates
Gold is extremely sensitive to real interest rates (interest rate minus inflation). When real returns on safe instruments feel weak, gold becomes more attractive—even without dramatic consumer jewellery demand.
4) Rupee vs Dollar Effect (India-Specific Booster)
India imports most of its gold, and international gold is priced in USD. Even if global gold rises moderately, a weaker rupee can make Indian prices jump sharply. This is why Indian gold often rises faster than global headlines suggest.
5) Investment Demand Beat Jewellery Demand
When prices get very high, jewellery demand can soften—but investment demand (bars, coins, ETFs) can still rise, especially if people believe uncertainty is increasing.
BankBazaar’s gold trend coverage and similar Indian trend sources consistently point to macro uncertainty, currency impact, and safe-haven flows as recurring drivers in large gold moves.
Significant Rises and Falls: Key Turning Points You Should Know
Biggest Rise Phases (From the Table)
- 1973 → 1974: ₹279 → ₹506 (inflation + global shocks)
- 1978 → 1980: ₹685 → ₹1,330 (strong safe-haven move)
- 2007 → 2008: ₹9,428 → ₹12,361 (financial crisis era)
- 2010 → 2012: ₹18,448 → ₹29,926 (super-rally)
- 2019 → 2020: ₹35,154 → ₹47,562 (pandemic shock)
- 2023 → 2024: ₹58,836 → ₹75,373 (fresh risk cycle)
Notable Correction / Cooling Periods
- 1975 → 1976: ₹540 → ₹432
- 1996 → 1998: ₹5,160 → ₹4,045
- 2012 → 2015: ₹29,926 → ₹26,671
- 2020 → 2021: flat consolidation near highs
What the 2026 Gold Surge Means for Indians: Consumers, Investors, and the Market
For jewellery buyers
High prices push behaviour changes:
- lighter designs
- lower karat (18K/14K)
- smaller purchases spread over time
For investors
Gold becomes portfolio insurance again. Many investors:
- allocate a fixed percentage
- buy systematic gold (SGB/ETF/digital gold depending on access)
- use gold as a hedge when equities feel overheated or uncertain
For households
Gold also affects:
- gold loan demand
- wedding budgets
- household savings behaviour
Gold Price Outlook After 2026: What History Suggests
History doesn’t predict the future perfectly, but gold’s 50-year pattern in India suggests:
- Long-term upward bias remains intact
- Large rallies are often followed by consolidation
- Corrections can happen, but they rarely erase multi-year gains
- Currency and inflation remain critical India-specific levers
If the macro environment remains uncertain, gold tends to hold high levels longer than people expect.
Conclusion: 50+ Years of Gold in India Prove One Thing—Gold Rewards Patience
From ₹63 per 10 grams in 1964 to around ₹1.5 lakh levels in early 2026, gold’s rise is not just a story of price—it’s a story of how Indians respond to uncertainty, inflation, and long-term wealth protection.
Gold has had dips: 1976, late 1990s, 2013–2015. But every time, over the long run, gold reasserted itself as a core store-of-value asset in the Indian context.
If 2026 has taught investors one thing again, it’s this:
When confidence in the world system drops, gold doesn’t need marketing—it moves on its own.