

Silver is often called “the poor man’s gold,” but in reality, it behaves like something much bigger: a precious metal + an industrial metal at the same time. In India, silver has deep cultural demand (jewellery, utensils, gifting), yet globally its price is heavily influenced by industrial use (electronics, solar panels, EVs, semiconductors). This dual identity is exactly why silver can stay quiet for years — and then suddenly explode.
Over the last five decades, silver prices in India have moved from a few thousand rupees per kilogram to multi-lakh levels, with some of the sharpest rallies seen in any mainstream asset. And the latest surge in 2025–2026 has been one of the most dramatic phases in Indian silver price history, with silver touching record highs in the domestic market and even crossing major psychological levels in trading and spot references.
This detailed guide covers:
- Year-by-year silver price in India (₹ per kg)
- The biggest rise and fall periods and what caused them
- Why silver is more volatile than gold
- Why silver surged aggressively in 2025–2026
- What this rally means for Indian buyers, investors, and businesses
Year-by-Year Silver Price in India (₹ per kg): Full Historical Table
Important note on data continuity (so you don’t get misled)
- BankBazaar’s silver history table provides annual average silver prices from 1981 to “present.”
- To complete a “50-year” view (1976 onward), the 1976–1980 numbers below are added from another widely-circulated historical compilation. These pre-1981 values can vary across sources because older datasets often differ in whether they use “year-end,” “annual average,” or city benchmarks.
- From 1981 onward, the table below follows BankBazaar’s year-wise series (most consistent for your requirement and the link you provided).
Silver Price History in India (₹/kg): 1976 to 2026
1976–1980 (extended to complete 50-year window)
| Year | Silver Price (₹/kg) |
|---|---|
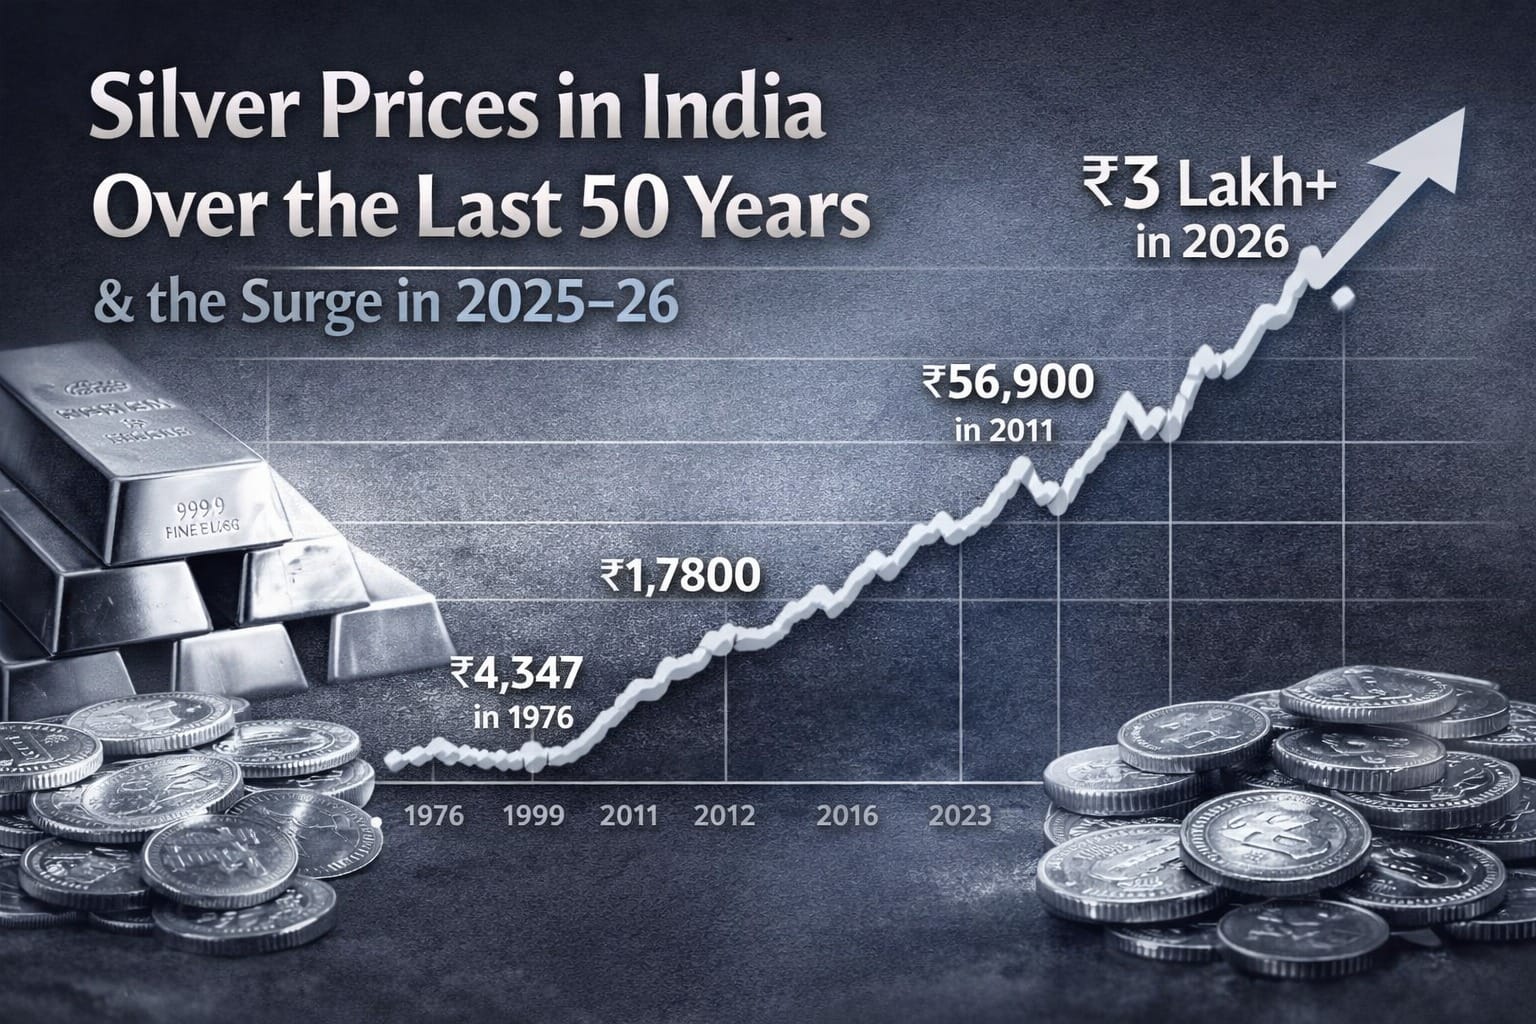
| 1976 | 4,347 |
| 1977 | 4,706 |
| 1978 | 5,930 |
| 1979 | 21,793 |
| 1980 | 16,393 |
(These five years are added to complete the 50-year time window since BankBazaar begins at 1981.)
1981–2026 (BankBazaar annual series)
| Year | Silver Price (₹/kg) | Year | Silver Price (₹/kg) | Year | Silver Price (₹/kg) |
|---|---|---|---|---|---|
| 1981 | 2,715 | 1996 | 7,346 | 2011 | 56,900 |
| 1982 | 2,720 | 1997 | 7,345 | 2012 | 56,290 |
| 1983 | 3,105 | 1998 | 8,560 | 2013 | 54,030 |
| 1984 | 3,570 | 1999 | 7,615 | 2014 | 43,070 |
| 1985 | 3,955 | 2000 | 7,900 | 2015 | 37,825 |
| 1986 | 4,015 | 2001 | 7,215 | 2016 | 36,990 |
| 1987 | 4,794 | 2002 | 7,875 | 2017 | 37,825 |
| 1988 | 6,066 | 2003 | 7,695 | 2018 | 41,400 |
| 1989 | 6,755 | 2004 | 11,770 | 2019 | 40,600 |
| 1990 | 6,463 | 2005 | 10,675 | 2020 | 63,435 |
| 1991 | 6,646 | 2006 | 17,405 | 2021 | 62,572 |
| 1992 | 8,040 | 2007 | 19,520 | 2022 | 55,100 |
| 1993 | 5,489 | 2008 | 23,625 | 2023 | 78,600 |
| 1994 | 7,124 | 2009 | 22,165 | 2024 | 95,700 |
| 1995 | 6,335 | 2010 | 27,255 | 2025 | 2,62,000 |
| 2026 (till today) | 2,48,000 |
Source: BankBazaar silver price trend table (1981–2026 till date).
Also read: Gold Prices in the last 50 years in India
What This 50-Year Silver Price Chart Really Tells You
If you only look at the start and end points, it looks like a straight line upward. But silver’s real story is not “steady growth.” It is long stretches of slow movement, then violent rallies, then sharp cool-offs, then another explosive phase.
That’s why silver is famous for being:
- More volatile than gold
- Faster in bull markets
- More painful in corrections
BankBazaar itself highlights that silver’s volatility is meaningfully higher than gold’s (they even reference standard deviation ranges as a simple volatility indicator), which matches how silver behaves historically.
Decade-by-Decade Silver Price Trend in India (With Major Highs and Lows)
1) Late 1970s to 1980: The “Old Silver Shock” Era
Silver’s pre-1981 period includes one of the most famous global silver episodes: the late-1970s spike associated with intense speculation and market stress, followed by a sharp decline. In the extended table, you can see an extreme jump in 1979 and then a drop in 1980, which reflects how violently silver can move.
This era matters because it created a long-lasting “silver memory”: whenever silver starts rallying fast, experienced commodity traders immediately compare it to the historical episodes of sudden spikes followed by sharp reversals.
2) 1981–1990: The Foundation Years (Low Prices, Gradual Growth)
According to the BankBazaar annual series, silver stayed relatively “low” through the early 1980s, rising from ₹2,715/kg (1981) to ₹6,755/kg (1989).
Key drivers in this period:
- India’s silver market was largely consumption-led (ornaments, utensils)
- Industrial demand was not yet the global “price engine” it is today
- Investment access was more limited than modern decades (no ETFs scale, less retail financialization)
By 1990, silver sat at ₹6,463/kg.
ALSO WATCH
3) 1991–2003: Fluctuations, But No “Big Bull Run” Yet
This is a critical period for understanding silver’s personality.
From:
- ₹6,646/kg (1991) to
- ₹7,695/kg (2003)
Silver moved, but not in a way that made headlines every year. Yet inside this range, you still see noticeable swings:
- 1992 jumps to ₹8,040/kg
- 1993 falls to ₹5,489/kg
That 1992–1993 dip matters: it’s a reminder that silver can fall hard even when it has long-term upward bias.
4) 2004–2011: The Modern Silver Repricing Begins
The first true “modern rally” begins in the mid-2000s.
Silver:
- ₹11,770/kg (2004)
- ₹17,405/kg (2006)
- ₹23,625/kg (2008)
This period overlaps with the global commodity super-cycle and rising investor interest in hard assets.
But the real breakout comes later:
- 2010: ₹27,255/kg
- 2011: ₹56,900/kg
That is a doubling-like move — the kind of move that changes public perception. This is when many Indian investors started seeing silver as “not just jewellery metal” but a serious asset.
5) 2012–2016: High Plateau, Then Cooling Down
Silver stayed high but cooled:
- 2012: ₹56,290/kg
- 2013: ₹54,030/kg
- 2014: ₹43,070/kg
- 2016: ₹36,990/kg
This is the classic post-rally consolidation. If you bought near peaks, it felt painful. If you zoom out, it was simply a reset before the next cycle.
6) 2017–2019: Sideways Years Before the Next Big Move
Silver hovered:
- 2017: ₹37,825/kg
- 2018: ₹41,400/kg
- 2019: ₹40,600/kg
Not exciting — but this phase built a base.
7) 2020–2024: Pandemic Aftermath, Industrial Demand, and the Setup for a Breakout
The next major shift begins:
- 2020: ₹63,435/kg
- 2021: ₹62,572/kg
- 2022: ₹55,100/kg
- 2023: ₹78,600/kg
- 2024: ₹95,700/kg
This is where silver’s “industrial metal” identity starts taking over the narrative. Globally, industrial demand has been a key driver—especially in electronics and electrical applications, and broader tech-linked demand.
Why Silver Surged Hard in 2025–2026 (And Why It’s Not Just “Inflation”)
Now to the part you specifically need: the reason for the surge.
BankBazaar’s annual history table shows:
- 2025: ₹2,62,000/kg
- 2026 (till today): ₹2,48,000/kg
But at the same time, news coverage shows silver crossing ₹3 lakh/kg in India in early 2026 (record levels on MCX/spot references).
These two can both be true because:
- BankBazaar’s figures are presented as annual average / averaged trend values, and 2026 is “till today” which can lag fast-moving spot highs.
- Market peaks reported in news are often intraday highs / spot peaks / contract highs, which can be well above averages.
The real drivers behind the 2025–2026 silver surge
1) Industrial Demand Became the Main Engine (Solar, EVs, Electronics)
Silver is not only “precious.” It’s crucial in:
- electronics and electrical applications
- solar photovoltaic (PV) components
- high-performance industrial uses
The Silver Institute notes that industrial demand has been a major supporting force and has posted record-strength periods, even when some other categories soften.
This matters because when industrial demand rises faster than supply, silver prices can move aggressively.
2) Persistent Supply–Demand Tightness and Deficit Narratives
One of the biggest reasons silver rallies suddenly is the market’s recurring concern about deficits.
Recent charting and analysis of silver’s imbalance highlights persistent deficit conditions in recent years, reinforcing bullish sentiment when demand expectations rise.
When investors believe “there isn’t enough silver to meet future industrial demand,” silver stops behaving like a sleepy commodity and starts behaving like a scarce strategic metal.
3) Safe-Haven Buying During Global Uncertainty (Silver Joined Gold)
Early 2026 reporting repeatedly ties the spike in precious metals to:
- heightened geopolitical uncertainty
- risk-off investor flows
- macro fear trades
Reuters reported record movements in gold and silver amid political risk and expectations around rates, with silver also hitting record highs in that context.
Even Indian coverage points to uncertainty and safe-haven behavior as a trigger for the move.
4) Rate-Cut Expectations and the “Non-Yielding Asset” Effect
When markets expect interest rates to fall (or real yields to weaken), non-yielding assets like precious metals become more attractive. Reuters explicitly connects the precious-metals rally environment to expectations around rate cuts and the “cost of holding” bullion.
Silver often gets an extra boost here because it has both “precious metal” momentum and “industrial scarcity” narratives.
5) India-Specific Amplifier: Currency Impact + Import Dependence
BankBazaar also emphasizes a core India factor: silver rates in India move with the USD/INR currency dynamic, and a weaker rupee makes silver costlier domestically even if international prices are stable.
That’s a crucial explanation for why Indian prices can look shockingly high compared to global headlines: the currency effect can amplify global moves.
6) The “Headline Threshold” Effect: ₹2 lakh → ₹3 lakh Psychology
In India, when silver crosses “round-number” milestones, participation jumps:
- traders chase momentum
- retail feels FOMO
- physical premiums rise in some markets
News coverage in late 2025 showed silver smashing the ₹2 lakh/kg mark, and early 2026 coverage showed the ₹3 lakh/kg milestone — both of which are psychologically explosive levels.
Biggest Rises and Falls in Indian Silver Prices (From the Year-Wise Table)
Major upswings
- 2004 → 2008: ₹11,770 → ₹23,625 (commodities upcycle + crisis era)
- 2010 → 2011: ₹27,255 → ₹56,900 (one of the sharpest modern rallies)
- 2019 → 2020: ₹40,600 → ₹63,435 (pandemic shock and safe-haven flows)
- 2022 → 2024: ₹55,100 → ₹95,700 (industrial narrative strengthens + macro stress)
- 2024 → 2025: ₹95,700 → ₹2,62,000 (historic repricing in the BankBazaar annual series)
Major corrections / cooling phases
- 2012 → 2016: ₹56,290 → ₹36,990 (post-rally reset)
- 2020 → 2022: ₹63,435 → ₹55,100 (cool-off after pandemic spike)
What the 2025–2026 Silver Rally Means for Indians
For jewellery and utensil buyers
High prices change behavior fast:
- lighter designs
- reduced discretionary purchases
- higher sensitivity to festival-season spikes
For investors
Silver becomes a “high-volatility hedge.” It can outperform in bullish cycles, but it can also draw down harder than gold. BankBazaar itself warns about silver’s extreme volatility relative to gold.
For industry and businesses
Industries that depend on silver-linked inputs watch prices closely, because cost spikes can compress margins.
Silver vs Gold: Why Silver Moves Faster (Up and Down)
Gold is primarily:
- monetary + jewellery + reserve asset
Silver is:
- monetary sentiment + jewellery/cultural demand plus heavy industrial linkage
That extra industrial layer makes silver sensitive to:
- tech cycles
- manufacturing demand
- supply constraints
- investment flows
So when conditions line up (industrial demand + safe-haven demand + macro uncertainty), silver can “snap” upward far faster than gold.
Conclusion: The Last 50 Years Prove Silver Is Not a Slow Asset — It’s a Cycle Asset
Silver’s Indian price history is a clear lesson: it rewards patience, but it punishes sloppy timing.
From the early decades of modest pricing to the modern era of explosive repricing, the metal has evolved from a cultural purchase into a globally strategic commodity with direct industrial importance. The 2025–2026 surge is best understood as a convergence of forces:
- industrial demand strength
- deficit/tightness expectations
- safe-haven flows amid geopolitical risk
- and India’s currency-linked amplification
If the global economy continues to push electrification, solar adoption, and high-performance electronics — while investors remain nervous about macro stability — silver is unlikely to behave like a calm commodity.
SUBSCRIBE TO OUR YOUTUBE CHANNEL THE LOGIC STICK FOR MORE VIDEO INSIGHTS